An analysis of the DVLA’s ‘stolen’ car data set for the years 2023, 2024 & 2025 The records include recoveries.
This is not a definitive account of all LoS records. The DVLA data almost certainly understates the ‘taken’ number as it is tainted by various issues – the ‘data caveats’. However, assuming year-on-year recording/submission consistency by the police and the DVLA, the records may provide a reasonable comparision.
CAR totals
| 2023 | 2024 | 2025 | |
|---|---|---|---|
| Taking (LoS) | 65,905 | 62,908 | 53,629 |
| Recovered | 26,725 | 27,015 | 23,857 |
| Recovery % | 40.61 | 42.89 | 44.49 |
Note – recovery figures, as held by the DVLA, will improve. The above data relates to vehicles notified as stolen and recovered to the DVLA in the same calendar year for comparision purposes. To explain, vehicles stolen in 2023 could be found in 2024 or 2025, whereas vehicles stolen in 2025 have a shorter period in which to be recovered.
As an indication of how the recovery rate will improve, from 01/01/2025 to 16/01/2025, a further 639 cars were marked ‘recovered’ at the DVLA, bringing the total recoveries to 24,469, the recovery percentage to 45.68.
The figures display:
Taking – the number of vehicles recorded by the DVLA as ‘stolen’ that year
Found – the number for which there is a recovery (police) date
% found – the recovery rate based upon the ‘taking’ & ‘found’ numbers
Recovery rate variance – the difference in recovery rates between 2023 and 2024. A ‘-ve’ conveys a reduction (worsening) in the number found.
Taking Difference – the difference in the number of vehicles taken between the two years – a ‘-ve’ conveys a reduction in taking records, an improvement in 2024
% taking variance – the difference in numbers regarding the 2023 & 2024 taking numbers. A ‘-ve’ indicates a reduction in taking, i.e. an improvement.
In November 2025, the BBC published theft statistics for VEHICLES, as opposed to just ‘cars’:
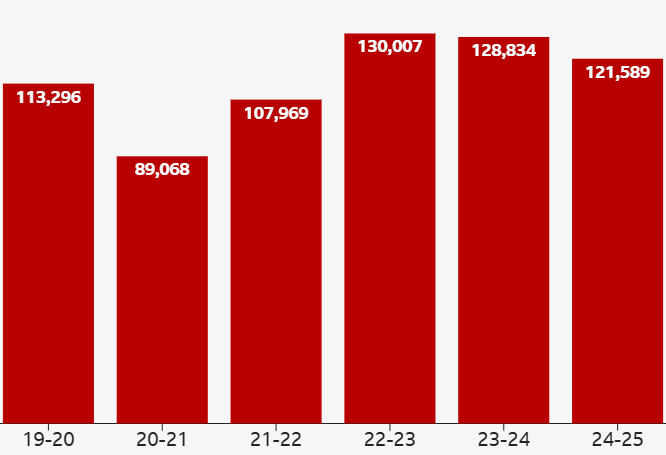
The above is Home Office data and the BBC has helpfully provided a drop-down to select. figures for a specific police service – click here to view the facility
DVLA data we acquired is below, the columns can be re-ordered by use of the header arrows.
| CARS | 2023 Taking | 2023 Found | 2023 % Found | 2024 Taking | 2024 Found | 2024 % Found | Recovery Rate Variance | 2024 Taking Difference | % taking variance | ||
|---|---|---|---|---|---|---|---|---|---|---|---|
| 1 | Army NIS Liaison | 1 | 1 | 100.00% | |||||||
| 42 | Nottingham | 580 | 171 | 29.48% | 517 | 152 | 29.40% | -0.08% | -63 | -10.86% | |
| 35 | Norfolk | 120 | 50 | 41.67% | 138 | 57 | 41.30% | -0.36% | 18 | 15.00% | |
| 56 | WMP | 9,512 | 3,994 | 41.99% | 9,356 | 3,887 | 41.55% | -0.44% | -156 | -1.64% | |
| 46 | S Yorkshire | 2,407 | 593 | 24.64% | 2,217 | 532 | 24.00% | -0.64% | -190 | -7.89% | |
| 11 | Derbyshire | 720 | 292 | 40.56% | 563 | 221 | 39.25% | -1.30% | -157 | -21.81% | |
| 54 | Warwickshire | 716 | 282 | 39.39% | 806 | 304 | 37.72% | -1.67% | 90 | 12.57% | |
| 41 | Not Known | 1,408 | 386 | 27.41% | 1,174 | 300 | 25.55% | -1.86% | -234 | -16.62% | |
| 29 | Lincolnshire | 248 | 127 | 51.21% | 253 | 124 | 49.01% | -2.20% | 5 | 2.02% | |
| 47 | Staffordshire | 1,027 | 489 | 47.61% | 1,197 | 534 | 44.61% | -3.00% | 170 | 16.55% | |
| 48 | Strathclyde | 836 | 523 | 62.56% | 735 | 435 | 59.18% | -3.38% | -101 | -12.08% | |
| 55 | W Mercia | 815 | 374 | 45.89% | 914 | 385 | 42.12% | -3.77% | 99 | 12.15% | |
| 7 | Cheshire | 413 | 213 | 51.57% | 399 | 185 | 46.37% | -5.21% | -14 | -3.39% | |
| 43 | PSNI | 225 | 131 | 58.22% | 240 | 124 | 51.67% | -6.56% | 15 | 6.67% | |
| 4 | BTP | 50 | 12 | 24.00% | 70 | 11 | 15.71% | -8.29% | 20 | 40.00% | |
| 19 | Gloucsetershire | 156 | 86 | 55.13% | 219 | 95 | 43.38% | -11.75% | 63 | 40.38% | |
| 8 | City of London | 3 | 2 | 66.67% | 0 | 0 | 0.00% | -3 | -100.00% | ||
| 34 | NCA | 1 | 0 | 0.00% | 0.00% | 1 | |||||
| 44 | Police Scotland | 1 | 1 | 100.00% | 1 | 1 | 100.00% | 0.00% | 0 | 0.00% | |
| 57 | W Yorkshire | 2,886 | 1,390 | 48.16% | 2,715 | 1,314 | 48.40% | 0.23% | -171 | -5.93% | |
| 26 | Kent | 1,258 | 380 | 30.21% | 1,429 | 451 | 31.56% | 1.35% | 171 | 13.59% | |
| 38 | Northampton | 367 | 149 | 40.60% | 386 | 163 | 42.23% | 1.63% | 19 | 5.18% | |
| 21 | GMP | 4,105 | 2,072 | 50.48% | 3,005 | 1,566 | 52.11% | 1.64% | -1,100 | -26.80% | |
| 28 | Leicestershire | 934 | 440 | 47.11% | 879 | 429 | 48.81% | 1.70% | -55 | -5.89% | |
| 36 | N. Wales | 79 | 28 | 35.44% | 59 | 22 | 37.29% | 1.85% | -20 | -25.32% | |
| 17 | Essex | 3,109 | 926 | 29.78% | 2,865 | 907 | 31.66% | 1.87% | -244 | -7.85% | |
| 15 | Durham | 288 | 119 | 41.32% | 287 | 124 | 43.21% | 1.89% | -1 | -0.35% | |
| 20 | Grampian | 71 | 47 | 66.20% | 95 | 65 | 68.42% | 2.22% | 24 | 33.80% | |
| 58 | Wiltshire | 196 | 87 | 44.39% | 234 | 111 | 47.44% | 3.05% | 38 | 19.39% | |
| 51 | Sussex | 709 | 346 | 48.80% | 632 | 328 | 51.90% | 3.10% | -77 | -10.86% | |
| 24 | Hertfordshire | 1,087 | 318 | 29.25% | 1,175 | 384 | 32.68% | 3.43% | 88 | 8.10% | |
| 32 | MPS | 19,131 | 7,206 | 37.67% | 18,528 | 7,655 | 41.32% | 3.65% | -603 | -3.15% | |
| 52 | Tayside | 151 | 105 | 69.54% | 147 | 108 | 73.47% | 3.93% | -4 | -2.65% | |
| 30 | Lothian & Borders | 477 | 269 | 56.39% | 474 | 286 | 60.34% | 3.94% | -3 | -0.63% | |
| 31 | Merseyside | 874 | 114 | 13.04% | 671 | 115 | 17.14% | 4.10% | -203 | -23.23% | |
| 3 | Bedford | 666 | 210 | 31.53% | 800 | 286 | 35.75% | 4.22% | 134 | 20.12% | |
| 53 | TVP | 1,687 | 728 | 43.15% | 1,593 | 755 | 47.39% | 4.24% | -94 | -5.57% | |
| 50 | Surrey | 834 | 281 | 33.69% | 644 | 249 | 38.66% | 4.97% | -190 | -22.78% | |
| 37 | N. Yorkshire | 248 | 130 | 52.42% | 240 | 138 | 57.50% | 5.08% | -8 | -3.23% | |
| 2 | Avon & Somerset | 859 | 483 | 56.23% | 876 | 538 | 61.42% | 5.19% | 17 | 1.98% | |
| 23 | Hampshire | 852 | 491 | 57.63% | 765 | 483 | 63.14% | 5.51% | -87 | -10.21% | |
| 5 | Cambridgeshire | 563 | 229 | 40.67% | 506 | 234 | 46.25% | 5.57% | -57 | -10.12% | |
| 40 | Northumbria | 598 | 232 | 38.80% | 572 | 257 | 44.93% | 6.13% | -26 | -4.35% | |
| 6 | Central Scotland | 92 | 59 | 64.13% | 66 | 47 | 71.21% | 7.08% | -26 | -28.26% | |
| 13 | Dorset | 239 | 122 | 51.05% | 270 | 157 | 58.15% | 7.10% | 31 | 12.97% | |
| 49 | Suffolk | 137 | 46 | 33.58% | 164 | 67 | 40.85% | 7.28% | 27 | 19.71% | |
| 25 | Humberside | 525 | 300 | 57.14% | 477 | 308 | 64.57% | 7.43% | -48 | -9.14% | |
| 18 | Fife | 168 | 101 | 60.12% | 116 | 79 | 68.10% | 7.98% | -52 | -30.95% | |
| 33 | NaVCIS | 746 | 395 | 52.95% | 576 | 355 | 61.63% | 8.68% | -170 | -22.79% | |
| 45 | S Wales | 972 | 435 | 44.75% | 1,069 | 574 | 53.70% | 8.94% | 97 | 9.98% | |
| 22 | Gwent | 241 | 65 | 26.97% | 187 | 68 | 36.36% | 9.39% | -54 | -22.41% | |
| 12 | Devon & Cornwall | 288 | 164 | 56.94% | 370 | 246 | 66.49% | 9.54% | 82 | 28.47% | |
| 10 | Cumbria | 69 | 43 | 62.32% | 68 | 50 | 73.53% | 11.21% | -1 | -1.45% | |
| 27 | Lancashire | 819 | 440 | 53.72% | 952 | 623 | 65.44% | 11.72% | 133 | 16.24% | |
| 9 | Cleveland | 281 | 62 | 22.06% | 208 | 72 | 34.62% | 12.55% | -73 | -25.98% | |
| 16 | Dyfed Powys | 40 | 16 | 40.00% | 52 | 28 | 53.85% | 13.85% | 12 | 30.00% | |
| 39 | Northern | 19 | 10 | 52.63% | 25 | 23 | 92.00% | 39.37% | 6 | 31.58% | |
| 14 | Dumfries & Galloway | 2 | 0 | 0.00% | 3 | 3 | 100.00% | 100.00% | 1 | 50.00% |